Top Locations with the Biggest House Price Jumps in 2025 – Is Your Town on the List?
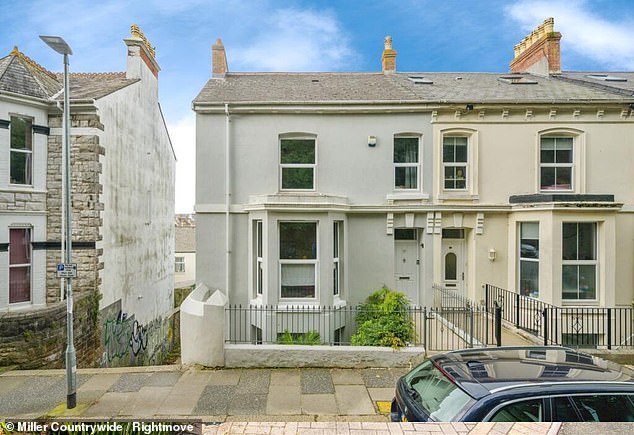
Plymouth, a city with a rich maritime history in Devon, has long been known as the starting point of the Mayflower voyage 400 years ago and as the home to western Europe's largest naval base. Once associated with explorer Sir Francis Drake, the city now holds another distinction: it has been named as the top 'housing hotspot' for 2025 by Lloyds.
The city saw the steepest increase in home values over the past year, with property prices rising from £247,579 to £278,808—an increase of £31,229. On average, property values in Plymouth rose by 12.6 per cent in 2025 compared to 2024, according to data based on Lloyds' mortgage records.
This growth has been attributed to major infrastructure developments such as Royal William Yard, a former naval area that has been transformed into a modern complex featuring homes and shops. Improved retail, dining, and lifestyle amenities have also contributed to making Plymouth more attractive, leading to increased property prices.
Stafford came in second place, with a rise of 12.0 per cent or £34,516 to £321,248. Wigan was third, with an increase of 10.5 per cent or £23,740 to £249,562. Other cities that made the top ten included Wakefield, Mansfield, Woking, Liverpool, Rugby, Falkirk, and Hull, all experiencing increases between 6.5 per cent and 8.7 per cent.


Top 10 Greatest Growth in Home Values: UK Towns and Cities 2024 to 2025
| Local Area | Region | Average Home Value 2024 | Average Home Value 2025 | £ Growth in Value | % Growth in Value |
|---|---|---|---|---|---|
| Plymouth | South West | £247,579 | £278,808 | £31,229 | 12.6% |
| Stafford | West Midlands | £286,732 | £321,248 | £34,516 | 12.0% |
| Wigan | North West | £225,822 | £249,562 | £23,740 | 10.5% |
| Wakefield | Yorkshire and the Humber | £263,381 | £286,268 | £22,887 | 8.7% |
| Mansfield | East Midlands | £223,807 | £243,251 | £19,444 | 8.7% |
| Woking | South East | £518,453 | £560,499 | £42,046 | 8.1% |
| Liverpool | North West | £236,864 | £254,550 | £17,686 | 7.5% |
| Rugby | West Midlands | £349,203 | £374,653 | £25,450 | 7.3% |
| Falkirk | Scotland | £222,718 | £238,512 | £15,794 | 7.1% |
| Hull | Yorkshire and the Humber | £187,142 | £199,348 | £12,206 | 6.5% |
Source: 2025 vs 2024, rolling 12-month data to end October each year. Locations only included where Lloyds Banking Group has made a minimum of 150 mortgage offers in the period, all buyers excluding Buy to Let and Shared Ownership.
Amanda Bryden, head of mortgages at Lloyds, said: "Our customers' dream homes are found in pockets around the UK, and we've supported thousands of people to take their next home-buying step this year. While property prices play a role, choosing where to live is also about finding a place that feels right—a community you connect with, a commute that works for you, and a lifestyle that fits you."
The South East dominated the areas where home values fell or grew most slowly in the past year. Crawley and High Wycombe recorded the sharpest declines, with home values falling by 8.9 per cent and 7.4 per cent respectively. A 6.4 per cent fall in average property values was also recorded in Chester, but the north west of England overall recorded growth of 3.7 per cent in property values.
Lloyds also recorded a 5.2 per cent fall in average property values in Cardiff, despite home values rising in Wales by 2.3 per cent generally.
Ms Bryden added: "If you've got your heart set on a particular location, it's worth taking time out to do some research and see what's happening with prices there, as swings in value at a local level can make a big difference to how much you may need for a deposit, stamp duty or wider moving costs."
Top 10 Biggest Falls in Home Values: UK Towns and Cities 2024 to 2025
| Local Area | Region | Average Home Value 2024 | Average Home Value 2025 | £ Fall in Home Value | % Fall in Home Value |
|---|---|---|---|---|---|
| Crawley | South East | £408,519 | £372,202 | -£36,317 | -8.9% |
| High Wycombe | South East | £471,373 | £436,379 | -£34,994 | -7.4% |
| Chester | North West | £363,529 | £340,415 | -£23,114 | -6.4% |
| Solihull | West Midlands | £416,268 | £390,292 | -£25,976 | -6.2% |
| Worcester | West Midlands | £353,701 | £331,977 | -£21,724 | -6.1% |
| Cardiff | Wales | £327,656 | £310,577 | -£17,079 | -5.2% |
| Cheltenham | South West | £433,208 | £411,593 | -£21,616 | -5.0% |
| Brighton | South East | £425,129 | £404,874 | -£20,254 | -4.8% |
| Barnsley | Yorkshire and the Humber | £226,176 | £215,552 | -£10,624 | -4.7% |
| Stockport | North West | £346,943 | £330,654 | -£16,289 | -4.7% |
Source: 2025 vs 2024, rolling 12-month data to end October each year. Locations only included where Lloyds Banking Group have made a minimum of 150 mortgage offers in the period, all buyers excluding Buy to Let and Shared Ownership.
UK Nations and Regions Growth in Home Values: 2024 to 2025
| Region | Average Home Value 2024 | Average Home Value 2025 | £ Growth in Home Value | % Growth in Home Value |
|---|---|---|---|---|
| Northern Ireland | £227,231 | £240,486 | £13,255 | 5.8% |
| Scotland | £248,098 | £257,399 | £9,302 | 3.7% |
| North West | £271,789 | £281,722 | £9,933 | 3.7% |
| Yorkshire and the Humber | £261,355 | £270,856 | £9,501 | 3.6% |
| South West | £351,039 | £360,317 | £9,278 | 2.6% |
| East Midlands | £290,635 | £297,588 | £6,953 | 2.4% |
| Wales | £256,892 | £262,854 | £5,961 | 2.3% |
| East of England | £409,044 | £417,897 | £8,853 | 2.2% |
| West Midlands | £300,784 | £304,640 | £3,856 | 1.3% |
| North East | £222,938 | £224,725 | £1,787 | 0.8% |
| South East | £449,454 | £452,961 | £3,507 | 0.8% |
| London | £574,855 | £574,514 | -£342 | -0.1% |
| UK | £352,124 | £365,110 | £12,986 | 3.7% |
Source: 2025 vs 2024, rolling 12-month data to end October each year. Regional data shows all Lloyds Banking Group mortgage offers in the region, no minimum sample applied.
"If you're open to exploring, you might find places where your money goes further. Northern regions and Scotland are still generally more affordable than the south of England, with a huge amount to offer in terms of culture and history, alongside some of the most beautiful parts of the UK countryside."
Lloyds compared the 12 months to October 2025 with the same months running to October 2024 for its research. Locations were only included where Lloyds had made a minimum of 150 mortgage offers during the period, excluding buy-to-let and shared ownership.
On a less localised level, Lloyds said that most parts of the UK recorded growth in the value of homes in 2025. Northern Ireland led the way with growth of 5.8 per cent, although property values fell in London by 0.1 per cent on average.


